Delhi Air Quality Remains Very Poor as Multiple Stations Record Severe Pollution and Fog Settles In
Delhi’s overall Air Quality Index remained in the ‘very poor’ category on Saturday morning, accompanied by moderate fog and high levels of PM2.5 and PM10 pollutants.

- Delhi's overall AQI was recorded at 348 on Saturday morning by the CPCB.
- Seven out of 59 monitoring stations recorded severe pollution levels.
- Visibility at Safdarjung dropped to 350 metres due to moderate fog.
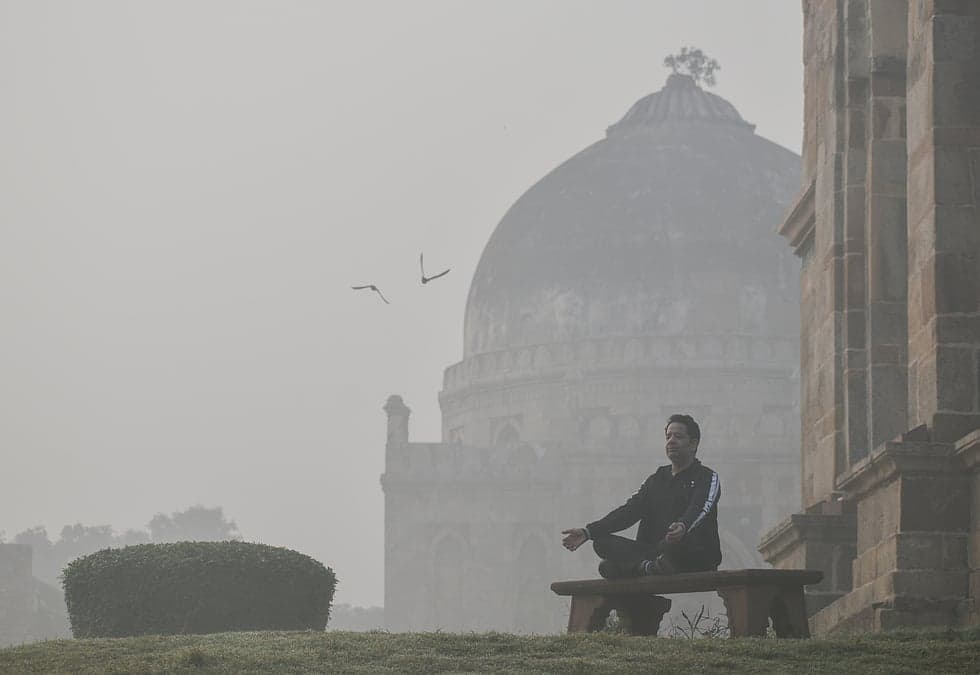
Delhi's air quality continued to remain in the 'very poor' category on Saturday morning. According to data from the Central Pollution Control Board, the overall Air Quality Index was recorded at 348 at 7.05 am, while Friday's average air quality index stood at 373 after briefly dipping into the severe category for nearly eight hours.
A thick layer of smog enveloped several sections of the national capital. PM2.5 and PM10 remained the major pollutants across the city, with PM2.5 identified as the primary pollutant at 50 monitoring stations. Out of the 59 monitoring stations across Delhi, seven recorded severe pollution levels during the morning hours, while eight stations registered poor air quality and Delhi Cantonment stood as the sole station in the moderate category.
Severe Monitoring Stations and Regional Variations
Several individual stations reported severe air quality readings exceeding the 400 mark. North Campus logged the highest reading at 421, closely followed by IIT Delhi at 419, ITO at 415, and Burari Crossing at 410. Other stations remained in the very poor bracket, including Chandni Chowk at 392, Jawaharlal Nehru University at 390, Anand Vihar at 379, Chhawla at 352, Connaught Place circles at 326, and Maidan Garhi at 300.
Visibility dropped significantly as moderate fog set into parts of the capital during the early morning hours. Data from the India Meteorological Department showed that visibility at Safdarjung deteriorated sharply from 2,000 metres on Friday evening to 350 metres by 2.30 am on Saturday, maintaining that level through 5.30 am. Meanwhile, visibility at Palam declined from 2,100 metres to 1,100 metres over the same timeframe without entering a fog category.
Meteorological Conditions and Stubble Burning Data
Minimum temperatures across the city remained relatively warm on Saturday. Safdarjung recorded a low of 16.4 degrees Celsius, which is 2.9 degrees above the seasonal normal. Other stations registered minimum temperatures above normal as well, with Palam at 16.7 degrees Celsius, Lodhi Road at 17.2 degrees Celsius, the Ridge at 17.3 degrees Celsius, and Ayanagar at 16.7 degrees Celsius. No rainfall was recorded across the five stations.
In connection with regional pollution contributors, satellite data from NASA indicated that 4,165 farm fires were detected across Punjab and Haryana between October 1 and November 13, including 58 fires on Friday. Punjab accounted for 3,782 of these incidents, while Haryana recorded 383. This cumulative figure tracks slightly lower than the 4,341 fires detected during the corresponding period in the previous year.
Government Response and Political Controversy
Authorities have implemented Stage III of the Graded Response Action Plan across the National Capital Region and surrounding areas since November 6. The Delhi government deployed water sprinklers across the city to help suppress particulate matter, while cloud-seeding trials under the supervision of IIT Kanpur remain underway to evaluate potential rainfall outcomes.
The administration's pollution response drew political friction when an opposition leader questioned the credibility of official air quality figures. Citing a study by the Centre for Research on Energy and Clean Air, allegations were raised that actual pollution levels exceeded government displays by nearly 49 per cent, and concerns were highlighted regarding the upper measurement limits of monitoring infrastructure.
- North Campus recorded the highest AQI at 421.
- PM2.5 and PM10 remained the primary pollutants across the city.
- Safdarjung's minimum temperature settled at 16.4 degrees Celsius.
Spotted an error? · Our editorial policy
UP NEXTSarfaraz Khan Details Emotional Toll of Dressing-Room Leak Allegations and Gambhir’s SupportOther angles · #air pollution
Timeline →- NewsDelhi’s Air Quality Hits ‘Poor’ at 279 With Several Areas Entering ‘Very Poor’ Zone
- NewsDelhi Air Quality Nears Very Poor Bracket as Calm Surface Winds Trap Pollutants
- NewsDelhi Schools Resume Physical Classes Following Withdrawal of GRAP Stage-III Restrictions
- NewsCitizens’ Delegation Visits Environment Ministry Office to Demand Air Pollution Action
More from Environment
Delhi Records Season’s Coldest Morning as Air Quality Remains in ‘Poor’ Category
Delhi registers coldest morning of the season with temperature dipping to 11.6 degrees Celsius

Deep Depression Intensifies Into Cyclonic Storm Akvan Over Bay of Bengal